Hello there!
Need Help? We are right here!
Need Help? We are right here!
Search Results:
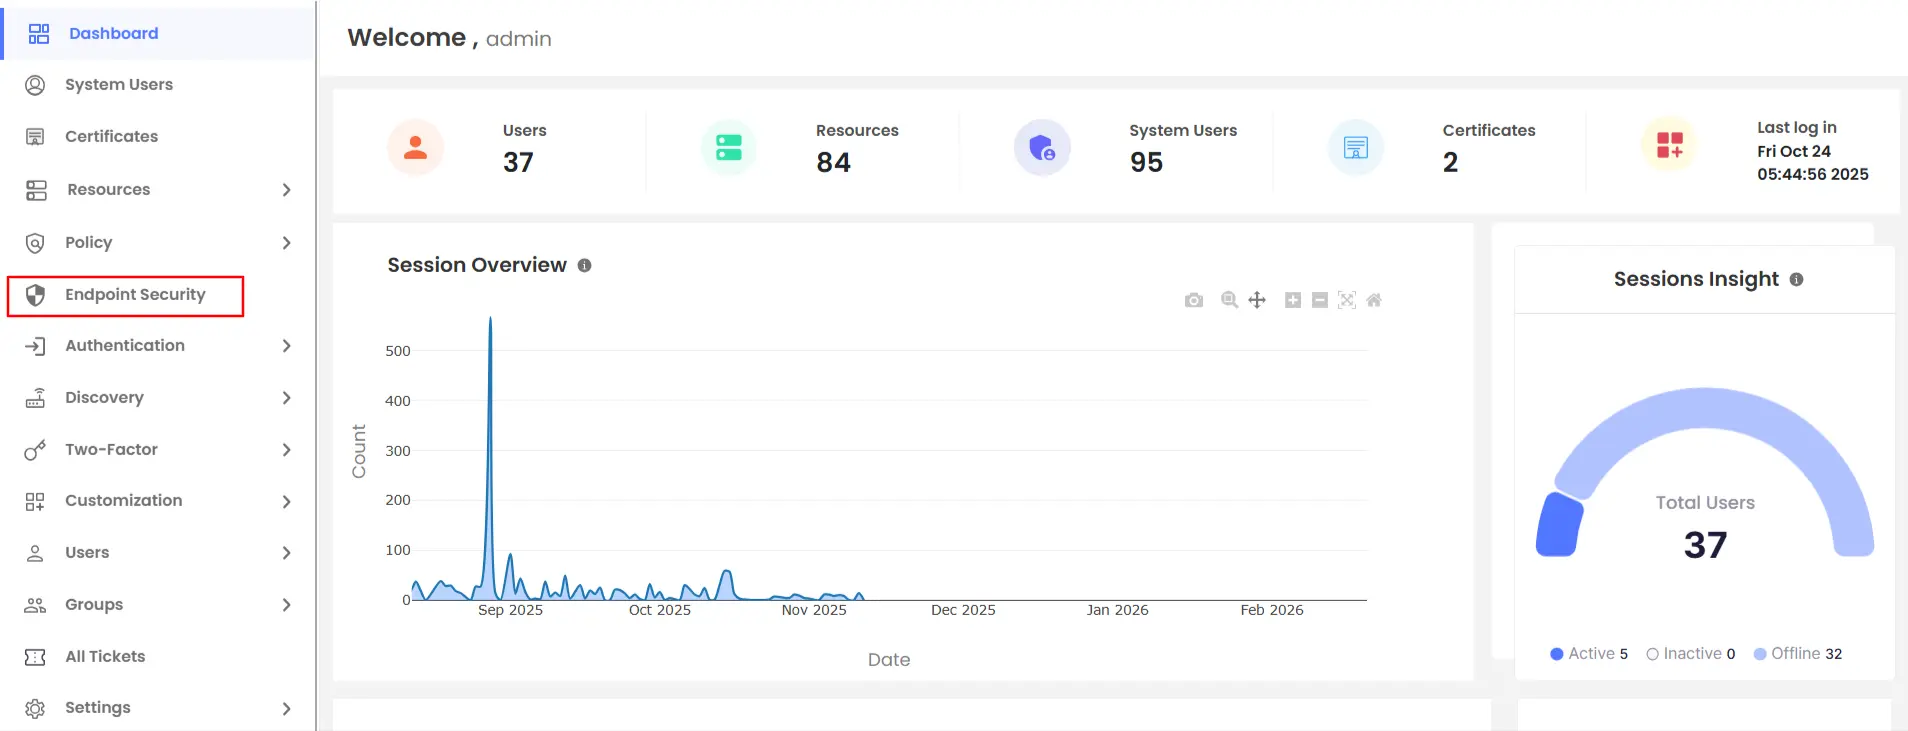
×The Endpoint Security Dashboard in miniOrange PAM provides administrators with a centralized view of endpoint security management, including user counts, policies, devices, and applications.
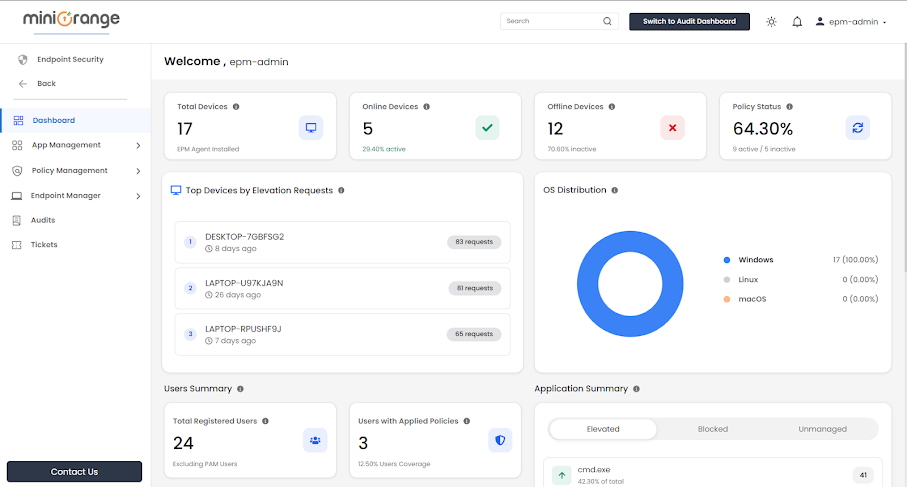
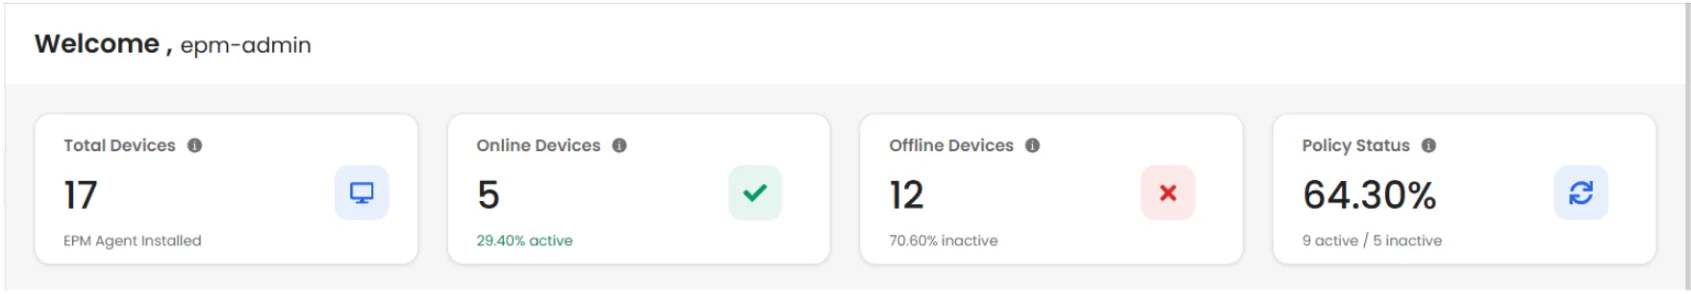
Displays the total number of endpoints where the EPM Agent is installed.
Indicates the number of endpoints where the EPM Agent is installed and currently running.
Represents endpoints where the EPM Agent is uninstalled.
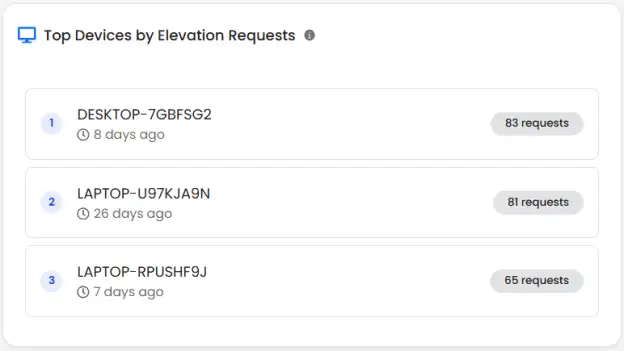
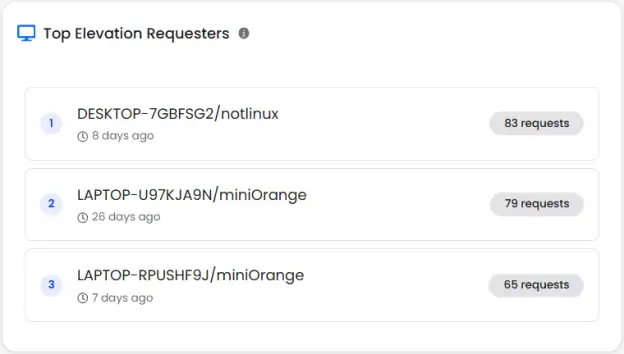
Highlights devices that generate the highest number of privilege elevation requests.
Each entry includes:
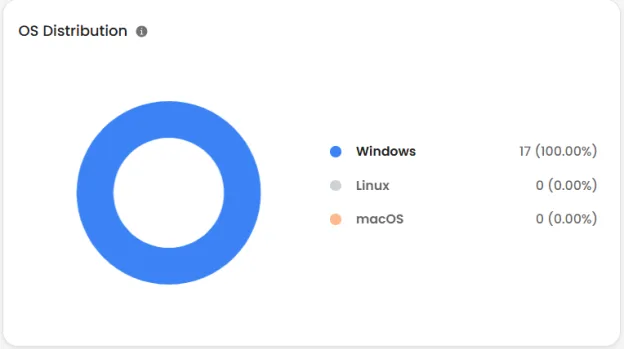
Visual breakdown of devices by operating system:
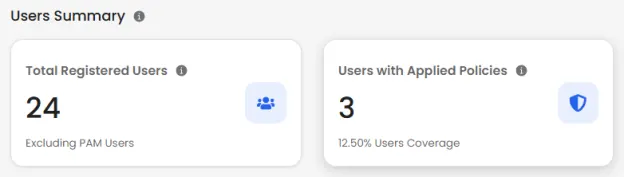
Displays the number of users registered in the EPM system.
Shows how many users are currently governed by at least one EPM policy.
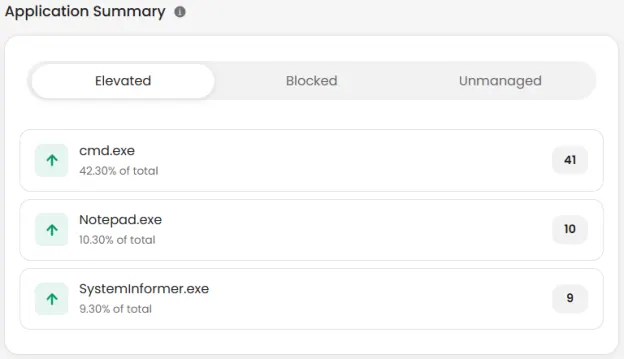
Elevated Applications
Blocked Applications
Unmanaged Applications
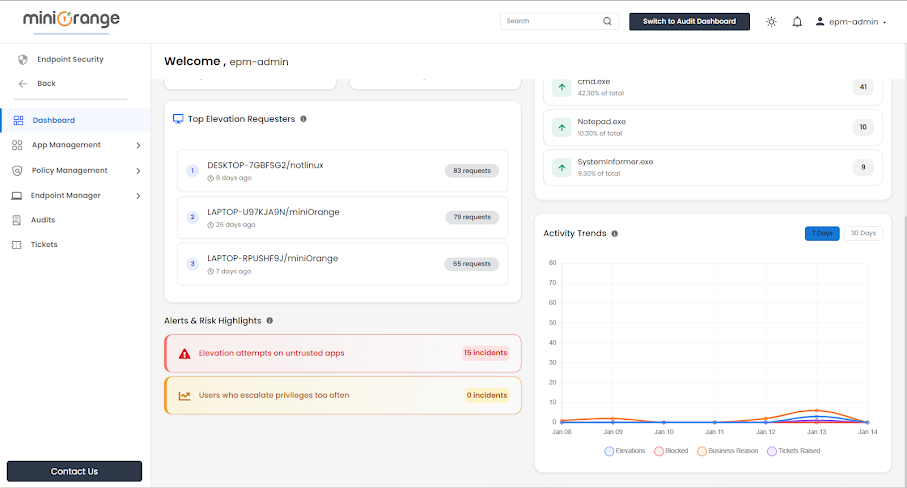
This feature identifies users who frequently request elevated access, including:
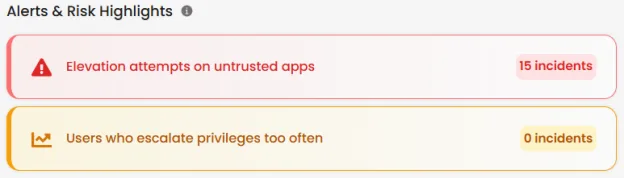
Counts untrusted applications that attempted privilege elevation in the last 30 days.
Counts users with more than 10 elevation requests within 2 hours.